单选题
编号:2695544
1. The diagram illustrates a consumer's allocation of her budget between items X and Y. With an initial budget (BC1) she consumes Qa units of item Y. When the price of Y drops, she consumes Qc un its of item Y. Lines BC2 and BC3 are parallel to one another.
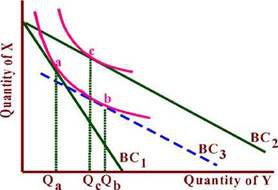
The income effect arising from this change in the price of Y is best described as the distance between:
The income effect arising from this change in the price of Y is best described as the distance between: