单选题
编号:2690675
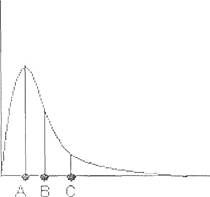
1. Consider the following graph of a distribution for the prices for various bottles of California-produced wine.
Which of the following statements is false?
Which of the following statements is false?